
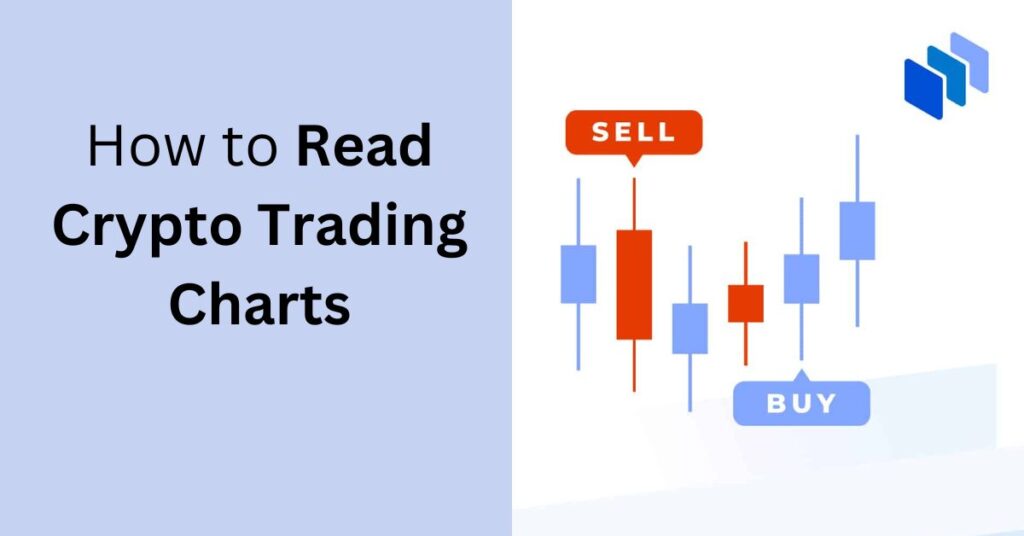
How To read crypto trading charts, focus on price movements, volume, and time intervals. Understand candlestick patterns to make informed decisions.
Crypto trading charts offer a visual representation of price movements over time. They are essential tools for traders to analyze market trends and predict future price actions. Candlestick charts are particularly popular as they provide detailed insights into opening, closing, high, and low prices. Volume indicators show the number of assets traded, helping gauge market activity. Time intervals on charts can range from minutes to months, allowing traders to tailor their analysis. By mastering these elements, you can enhance your trading strategies and make more informed decisions in the volatile world of cryptocurrency.
Table of Contents
Introduction To Crypto Trading Charts
Understanding crypto trading charts is crucial for every trader. These charts offer a visual representation of price movements. They help traders make informed decisions. In this section, we will explore the basics of crypto trading charts. Crypto trading charts are essential tools for traders. They show the historical performance of a cryptocurrency. By analyzing these charts, traders can predict future price movements. Charts provide a clear picture of market trends. They help identify patterns and support decision-making. Using charts, traders can spot buying and selling opportunities.
Basic Chart Types
There are several types of crypto trading charts. Each type serves a different purpose. Here are the most common chart types. Understanding these basic chart types is essential. Each type offers unique insights into market behavior. Choose the right chart to suit your trading needs.
- Line Charts: These are the simplest charts. They show the closing prices over time. They are easy to read but lack detail.
- Bar Charts: Bar charts provide more information. They show the opening, closing, high, and low prices. They are useful for identifying price ranges.
- Candlestick Charts: These are the most popular charts. They show the same data as bar charts but in a more visual format. Each candlestick represents a specific time period.
Understanding Candlestick Charts
Reading crypto trading charts can be challenging for beginners. One crucial tool in your trading arsenal is the candlestick chart. These charts provide valuable insights into market movements. Understanding candlestick charts will help you make better trading decisions.
Components Of A Candlestick
A candlestick has four key components:
- Open: The price at which the asset starts trading in a period.
- Close: The price at which the asset ends trading in a period.
- High: The highest price during the trading period.
- Low: The lowest price during the trading period.
Each candlestick shows these price points through its body and wicks (or shadows). The body represents the open and close prices. The wicks show the high and low prices. Candlesticks come in two colors: typically green and red. A green candlestick means the closing price is higher than the opening price. A red candlestick means the closing price is lower than the opening price.
Reading Candlestick Patterns
Candlestick patterns are essential for predicting market trends. Some common patterns include. Understanding these patterns can help you identify buying and selling opportunities. Practice reading these patterns to improve your trading skills. By studying candlestick charts, you can gain deeper insights into market dynamics. This knowledge will empower you to make informed trading decisions.
- Doji: Indicates market indecision. The open and close prices are almost the same.
- Hammer: Signifies a potential reversal. A small body with a long lower wick.
- Engulfing: A larger candle engulfing a smaller one. Shows a strong market reversal.
| Pattern | Indicator |
|---|---|
| Doji | Market indecision |
| Hammer | Potential reversal |
| Engulfing | Strong market reversal |
Key Indicators In Crypto Chart Reading
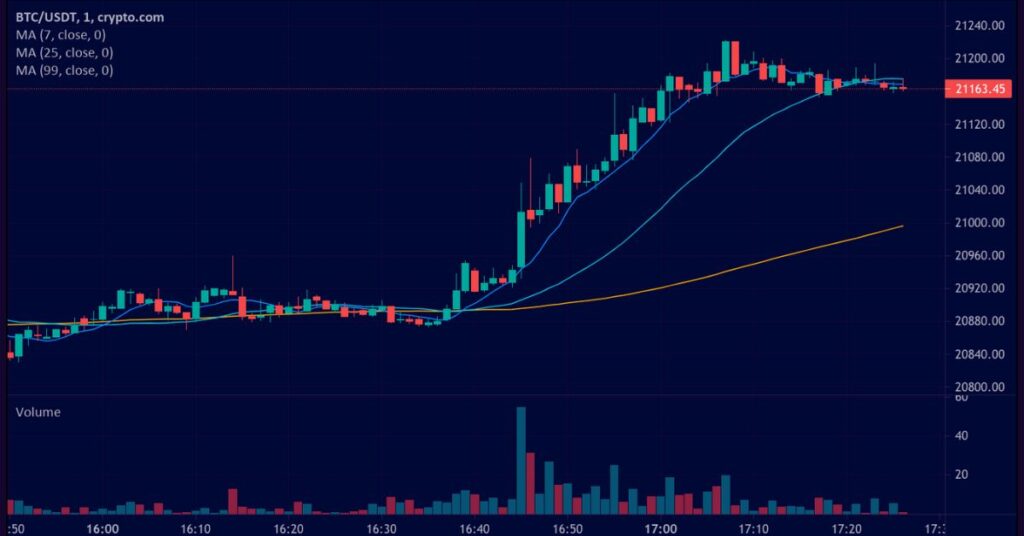
Understanding crypto trading charts is essential for making smart investment decisions. Key indicators can help you identify trends and make informed choices. Let’s explore two important indicators: Moving Averages and the Relative Strength Index (RSI).
Moving Averages
Moving Averages (MA) help smooth out price data to identify trends. There are two main types: Simple Moving Averages (SMA) and Exponential Moving Averages (EMA).
| Type | Description |
|---|---|
| SMA | Calculates the average price over a specific period. |
| EMA | Gives more weight to recent prices, making it more responsive. |
- SMA is useful for long-term trends.
- EMA is better for short-term trends.
Using moving averages can help you see if a crypto asset is in an uptrend or downtrend. When the price exceeds the moving average, it might signal a potential uptrend. Conversely, if the price drops below the moving average, it could indicate a potential downtrend.
Relative Strength Index
The Relative Strength Index (RSI) measures the speed and change of price movements. It is a momentum oscillator that ranges from 0 to 100. An RSI above 70 suggests that the asset might be overvalued. This could be a signal to sell. On the other hand, an RSI below 30 suggests that the asset might be undervalued. This could be a signal to buy. The RSI helps you understand if a crypto asset is overbought or oversold. This information can guide your trading decisions and help you avoid buying high and selling low.
- RSI above 70 indicates an overbought condition.
- RSI below 30 indicates an oversold condition.
Identifying Reading Cryptocurrency Charts Trends
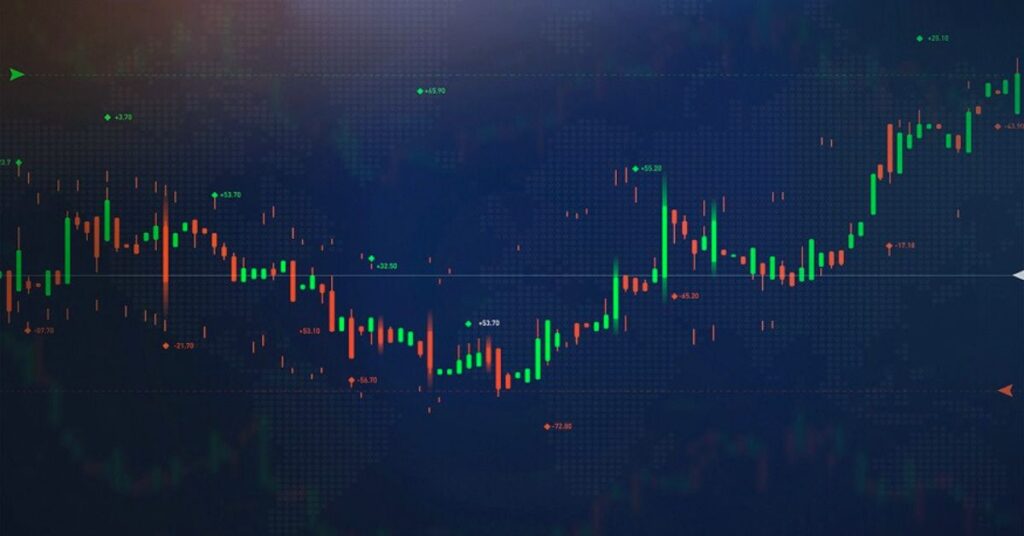
Reading crypto trading charts can be tricky. One key skill is identifying trends. Trends show the general direction of a coin’s price. Learning to spot trends helps make better trading decisions.
Bullish Vs Bearish Trends
A bullish trend means prices are going up. Traders buy during bullish trends. They hope to sell later at a higher price. A bearish trend means prices are going down. Traders sell during bearish trends. They aim to buy back at a lower price.
| Trend Type | Price Direction | Trader Action |
|---|---|---|
| Bullish | Up | Buy |
| Bearish | Down | Sell |
Using Trend Lines
Trend lines help identify the direction of the market. A trend line is a straight line drawn on the chart. It connects two or more price points. Uptrend lines connect the lows in a bullish trend. They show support levels. Downtrend lines connect the highs in a bearish trend. They show resistance levels. Trend lines help predict future price movements. They show where prices might reverse. This helps traders decide when to buy or sell.
- Find two significant low points for uptrend lines.
- Find two significant high points for downtrend lines.
- Draw a straight line connecting these points.
Volume Analysis
Understanding volume analysis is key to mastering crypto trading charts. Volume shows the number of coins traded over a period. High volume indicates strong market interest. Low volume suggests weak interest. This section covers the importance of volume and various volume indicators.
Importance Of Volume
Volume is crucial in crypto trading. It helps confirm trends and reversals. A price movement with high volume is more reliable. Low volume may indicate a false trend. Here are some key points:
- Confirms Trends: High volume validates a price trend.
- Identifies Reversals: Sudden volume spikes can signal trend changes.
- Market Sentiment: Volume reflects trader interest and confidence.
Volume Indicators
Volume indicators help traders understand market activity. They provide insights into potential price movements. Here are some popular volume indicators. Using these indicators can enhance your trading strategy. They provide a deeper understanding of market dynamics. Always consider volume along with price action. This combined approach offers a clearer market picture.
| Indicator | Description |
|---|---|
| On-Balance Volume (OBV) | Tracks cumulative volume. It adds volume on up days and subtracts on down days. |
| Volume Moving Average (VMA) | Shows average volume over a specific period. Helps smooth out volume data. |
| Chaikin Money Flow (CMF) | Measures buying and selling pressure. Values range from -1 to +1. |
Common Mistakes To Avoid Free Crypto Chart
Reading crypto trading charts can be complex. Many beginners make common mistakes. Avoiding these mistakes can improve your trading success. Learn about these pitfalls and how to avoid them.
Overtrading
Overtrading is a common mistake. Many new traders trade too much. This happens when emotions drive decisions. It leads to poor choices and losses. Here are some signs of overtrading:
- Trading without a plan
- Chasing losses
- Making trades out of boredom
To avoid overtrading, follow these tips:
- Set clear trading goals
- Stick to a trading plan
- Take breaks regularly
Ignoring Risk Management
Many traders ignore risk management. This is a big mistake. Proper risk management protects your capital. Some risk management strategies include. Ignoring these strategies can be costly. Always manage your risks well. This ensures long-term success in crypto trading.
| Strategy | Description |
|---|---|
| Stop-Loss Orders | Automatically sell at a set price to limit losses |
| Position Sizing | Only risk a small percentage of your capital per trade |
| Diversification | Spread investments across different assets |
Frequently Asked Questions For How to Read Crypto Trading Charts
What Are Candlestick Charts In Crypto Trading?
Candlestick charts show price movements within a specific time frame using colored bars.
How To Read Support And Resistance Levels?
Support levels indicate where prices tend to stop falling. Resistance levels show where prices often stop rising.
What Is A Moving Average In Trading?
A moving average smooths out price data to identify trends over a specific period.
How To Identify Trends In Crypto Charts?
Look for consistent upward or downward movements in the price over time to identify trends.
Why Are Volume Indicators Important?
Volume indicators show the number of assets traded, helping to confirm price movements and trends.
What Are Fibonacci Retracement Levels?
Fibonacci retracement levels are horizontal lines that indicate potential support and resistance levels based on the Fibonacci sequence.
Conclusion
Mastering crypto trading charts can enhance your trading skills. Understanding patterns and indicators is crucial. Practice regularly to gain confidence. Stay updated with market trends. Use reliable tools and resources. With dedication, you can make informed trading decisions. Start reading charts today and unlock your potential in crypto trading.