Summary
The average body range in trading refers to the difference between the opening and closing prices within a specific time frame. Traders use this metric to gauge market volatility and price movement. In trading, the “Average Body Range” refers to the average size of the real body of candlesticks over a specified period. The real body is the range between the open and close prices of a candlestick, reflecting the price movement during that time. Traders analyze the average body range to gauge market volatility and momentum. A larger average body range indicates higher price movement, often signaling strong trends, while a smaller range suggests lower volatility and potential consolidation. It is commonly used with other indicators for comprehensive market analysis.
Table of Contents
True What Is The Average Body Range In Trading?
What is the average body range in trading? It measures market volatility by analyzing the range between high and low prices over a set period. It helps traders assess market conditions and make informed decisions. Trading involves various technical indicators to gauge market volatility. One crucial metric is the Average True Range (ATR). Let’s explore this concept in detail.
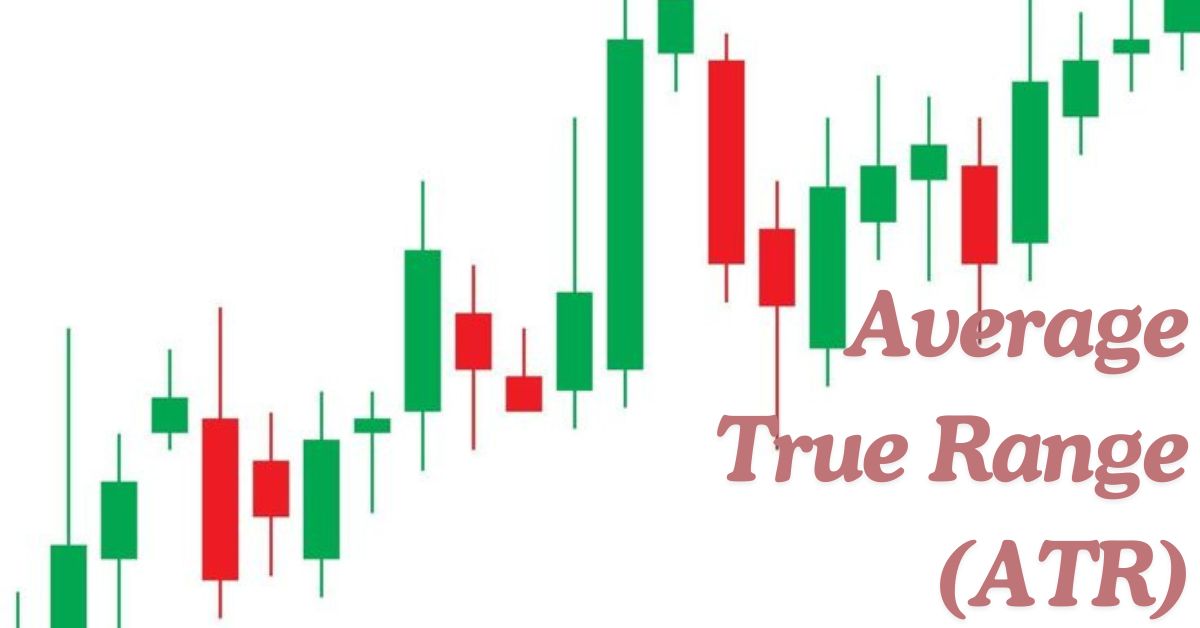
What Is the Average True Range (atr)?
ATR measures volatility over a specific period. It helps traders understand market fluctuations. The calculation involves several steps, which are simplified here:
| True Range (TR) | The greatest of the current high minus the current low, the absolute value of the current high minus the previous close, or the absolute value of the current low minus the previous close. |
| Average True Range | Typically a 14-period exponential moving average of the True Range values. |
Importance Of Atr In Trading
Understanding ATR offers several benefits:
| Volatility Insight | ATR provides a clear insight into market volatility. |
| Risk Management | Helps in setting stop-loss levels. |
| Trend Identification | Assists in recognizing potential trend changes |
Practical Application Of Atr
Traders use ATR in various ways. Here are some practical uses:
| Position Sizing | Adjusting trade size based on volatility. |
| Setting Stop-Loss | Determining stop-loss levels to manage risk. |
| Market Entry and Exit | Identifying optimal points for entering or exiting trades. |
What Is The Average Daily Range Formula in Trading?
The average daily range in trading measures the price movement between the high and low of a trading day. This metric helps traders gauge market volatility and potential profit opportunities. Understanding the average daily range aids in making informed trading decisions. Understanding the average daily range in trading can help traders make informed decisions. This metric shows the average movement in price for a specific asset within a single trading day. Knowing this helps traders anticipate potential price fluctuations and plan their strategies accordingly. The average daily range is essential for traders. It provides insight into the typical volatility of an asset.
Calculating The Average Daily Range
To calculate the average daily range, follow these steps. Collect the high and low prices for the asset over a specific period. Subtract the low price from the high price for each day. Sum the daily ranges and divide by the number of days.
Importance Of Average Daily Range
Understanding The average body range in trading can benefit traders in several ways. It helps gauge how volatile an asset is: the higher the range, the more volatile the asset. Traders can set more effective stop-loss levels: using the range, they can avoid being stopped by normal price fluctuations. It aids in planning entries and exits: knowing the range helps in timing trades better.
Factors Affecting Daily Range
Several factors can influence the daily range of an asset. Here’s a look at some key elements. Major news events can cause significant price movements: positive or negative news impacts the asset’s price. Reports like employment figures or GDP can affect prices: these reports can lead to increased volatility. Trader emotions and market sentiment play a role: fear or greed can drive prices up or down.
Utilizing Average Daily Range In Strategies
Incorporating the average daily range into trading strategies can enhance decision-making. Short-term traders use the range to capture small price movements: they enter and exit trades quickly. Swing traders rely on the range to identify potential entry and exit points: they hold positions for several days. Long-term traders use the range to understand overall market conditions: it helps in holding positions for weeks or months. Understanding and using the average daily range can significantly impact trading success. By incorporating it into your strategies, you can make more informed decisions and improve your trading outcomes.
What Is The Range For Trading?
In trading, What is The average body range in trading (ABR) measures the typical price movement within a trading period. It helps traders identify potential market volatility and price fluctuations. Understanding ABR aids in setting more accurate stop-loss and take-profit levels. The concept of range is vital in trading, offering insights into market volatility and potential profit margins. Understanding the average body range aids traders in making informed decisions, optimizing strategies, and managing risks.
Definition Of Trading Range
The average body range in trading represents the spread between the high and low prices of an asset within a specific period. This range provides insight into market behavior and volatility.
Importance Of Trading Range In Analysis
Recognizing the significance of the trading range can enhance trading strategies. Here are key points to consider:
| Market Volatility | Indicates the degree of price fluctuation |
| Support and Resistance Levels | Helps identify critical price points. |
| Trend Analysis | Aids in determining market direction. |
Calculating The Average Body Range
Calculating The average body range in trading requires understanding the formula and its components. The average body range is computed as the difference between the high and low prices over a period, averaged over a specified timeframe.
Factors Influencing Trading Range
Several factors can impact the trading range of an asset. Understanding these can help in predicting future movements. Influences traders’ buying and selling decisions. Affect market performance and volatility. Can cause sudden price movements. Higher liquidity often results in narrower ranges.
Practical Uses Of Trading Range
Utilizing the trading range effectively can improve trading outcomes. Here’s how:
| Identifying Breakouts | Helps spot potential significant price movements. |
| Setting Entry and Exit Points | Assists in planning trades. |
| Evaluating Market Conditions | Offers a snapshot of market health. |
| Adjusting Trading Strategies | Enables fine-tuning based on market behavior |
Average True Range Formula
In trading, the Average True Range (ATR) formula measures market volatility by averaging the True Range (TR) values over a specified period, typically 14 periods. ATR does not indicate price direction but helps traders identify volatility levels, set stop-losses, and plan entry or exit strategies. The True Range is calculated as the greatest of:
- The current high minus the current low.
- The absolute value of the current high minus the previous close.
- The absolute value of the current low minus the previous close.

What Is Average Trading Range Tradingview?
What is The average body range in trading indicates the average size of a trading candle’s body. It helps traders assess market volatility. This metric assists in identifying potential trading opportunities by analyzing price movements within a specific period. Understanding the average trading range on TradingView is crucial for traders. This metric helps identify market volatility, providing a clearer picture of potential price movements.
How To Use Average Trading Range On Tradingview
TradingView offers tools to utilize the ATR effectively. Here’s how you can harness this feature. Go to the indicators section and search for “Average True Range”. This will display the ATR on your chart. Customize the period according to your trading strategy. Common settings include 14 or 20 periods. Use the ATR to gauge market volatility. Higher values indicate higher volatility and lower values suggest lower volatility.
Benefits Of Using Average Trading Range
Using the ATR on TradingView provides various advantages. The ATR helps set stop-loss levels. Adjust stops according to market volatility. Identify periods of high volatility for potential trading opportunities. Avoid low-volatility periods to reduce risk. Gain better insights into market trends. Use ATR to confirm the strength of price movements.
Practical Examples Of Tradingview
Consider applying the ATR to real trading scenarios. Here’s a practical breakdown. A high ATR reading during a breakout might signal a strong trend. Traders can enter positions with confidence. A low ATR during consolidation periods suggests caution. Traders might wait for a clear breakout before entering trades. Use the ATR to set trailing stops. This allows you to lock in profits while accommodating price fluctuations.
Customizing Atr For Your Strategy
Tailoring the ATR to fit your trading style is essential. Here’s how to do it. Use a shorter period, like 10 days, to capture quick price movements. Opt for a longer period, such as 50 days, to smooth out volatility and focus on broader trends. Enhance your strategy by combining ATR with other indicators like moving averages. This provides a more comprehensive market analysis. By understanding and applying the average trading range on TradingView, traders can better navigate market volatility and make informed decisions.
The Average True Range ATR Formula Forex
The Average True Range (ATR) formula measures market volatility in trading. It calculates the average range between high and low prices over a specific period. Traders use ATR to gauge potential price movements. Trading can be a rollercoaster, with prices swinging up and down. Understanding these movements is key to making informed decisions. One tool that traders rely on is the Average True Range (ATR) formula. Let’s delve into what ATR is and how it can help you navigate the volatile world of trading.
What Is Atr?
The Average True Range (ATR) measures market volatility. It calculates the average range of price movements over a specific period.
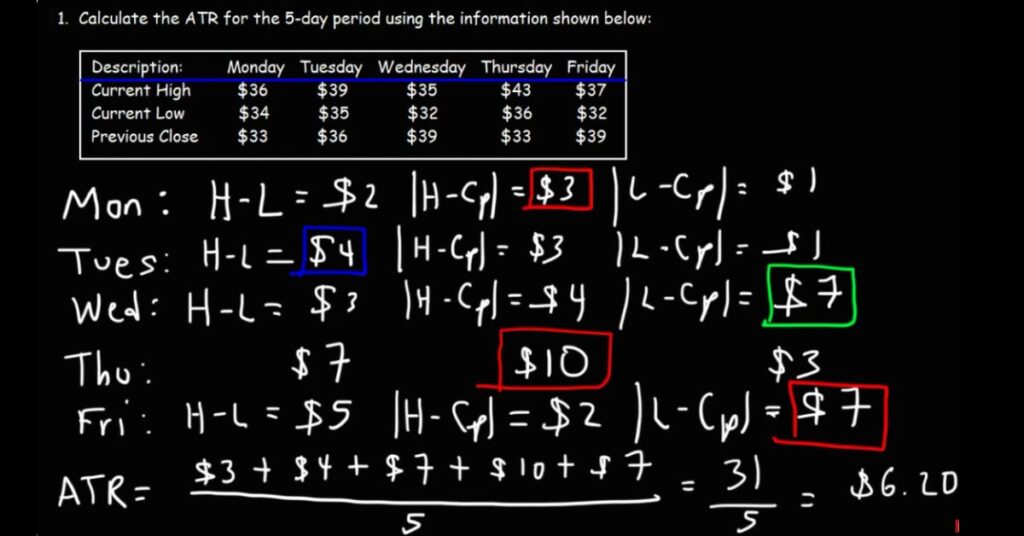
How Is Atr Calculated?
To comprehend ATR, it’s crucial to understand its calculation process. Here’s a step-by-step breakdown. The TR is the greatest of three values: current high minus current low, current high minus previous close, or current low minus previous close. Compute this value for each day over the chosen period. Sum the TR values and divide by the number of periods to get the ATR.
Why Use Atr?
ATR offers several benefits that can enhance your trading strategy. Here are a few reasons. ATR helps traders gauge market volatility, which can inform risk management. Traders use ATR to set stop-loss orders, helping to protect against significant losses. ATR can confirm the strength of price breakouts, ensuring more reliable trading signals. Understanding the ATR formula and its applications can significantly improve your trading strategies. By accurately measuring market volatility, you can make more informed decisions and better manage your risks.
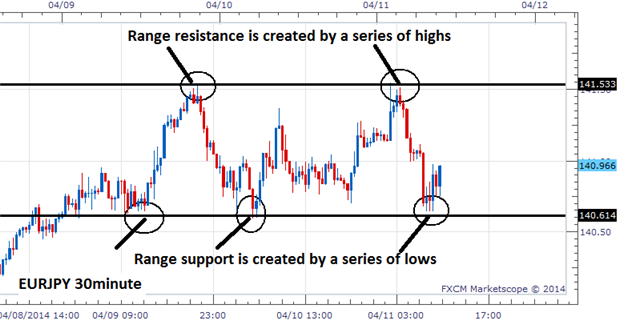
Range Support And Resistance
The average body range in trading reflects the difference between the highest and lowest prices of a security within a specific period. Traders use this metric to identify key support and resistance levels, helping them make informed decisions. Understanding this range is crucial for effective market analysis and strategy development. Understanding the dynamics of range support and resistance is vital for traders. These concepts help identify potential entry and exit points, making trading strategies more effective.
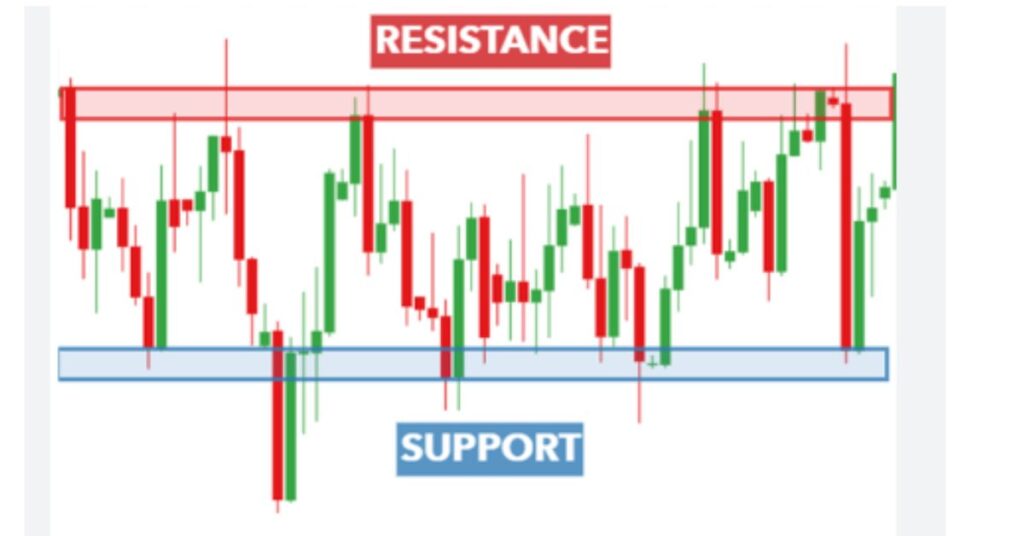
Range Support
Support levels are crucial for traders. They signal where the price might stop falling and start rising.
| Definition | The price level where demand is strong enough to prevent further decline. |
| Identification | Look for multiple touches of the same price level without breaking below it. |
| Significance | Indicates a price floor that traders can use as a buying opportunity. |
Range Resistance
Resistance levels play a key role in trading strategies. They show where the price might stop rising and start falling.
| Definition | The price level where selling pressure is strong enough to prevent further rise. |
| Identification | Observe multiple touches of the same price level without breaking above it. |
| Significance | Acts as a price ceiling, offering a potential selling point. |
Role In Trading Strategies
Range support and resistance are fundamental to many trading strategies. They provide key indicators for decision-making.
| Trend Reversal | Identifying when a price trend might reverse direction. |
| Entry and Exit Points | Finding optimal points for entering or exiting trades. |
| Risk Management | Setting stop-loss orders to minimize potential losses. |
Tools For Identifying Support And Resistance
Traders use various tools to identify support and resistance levels. These tools enhance accuracy and efficiency. Recognizing range support and resistance can transform your trading approach. It helps in making informed and strategic trading decisions.
| Trend Lines | Connect highs or lows to identify support and resistance. |
| Moving Averages | Use averages to smooth out price data and highlight levels. |
| Fibonacci Retracement | Apply Fibonacci ratios to predict potential support and resistance levels. |
Frequently Asked Questions For
What Is The Average Body Range?
What is The average body range in trading refers to the typical price movement within a specified time frame.
How Is Average Body Range Calculated?
What is The average body range in trading is calculated using historical price data, often involving the opening and closing prices.
Why Is Average Body Range Important?
It helps traders understand market volatility and set more accurate stop-loss and take-profit levels.
Does Average Body Range Affect Trading Strategies?
Yes, it influences strategies by indicating potential price fluctuations, and guiding entry and exit points.
What Time Frames Are Used?
Common time frames include daily, weekly, and monthly ranges, depending on the trading strategy.
Can Average Body Range Predict Market Trends?
While it indicates volatility, it doesn’t predict trends. It’s used alongside other indicators for better analysis.
Conclusion
Understanding What is The average body range in trading is crucial for success. It helps traders make informed decisions. By mastering this concept, you can enhance your trading strategy. Stay informed, practice regularly, and always analyze your trades. This knowledge can lead to more consistent and profitable trading outcomes.