
Summary The MACD trading strategy is a popular tool in technical analysis that assists traders in spotting potential buy and sell signals by examining price momentum and trends. It comprises three main elements: the MACD line, the Signal line, and the Histogram. The MACD line represents the difference between two exponential moving averages (typically the 12-period and 26-period EMAs), while ...
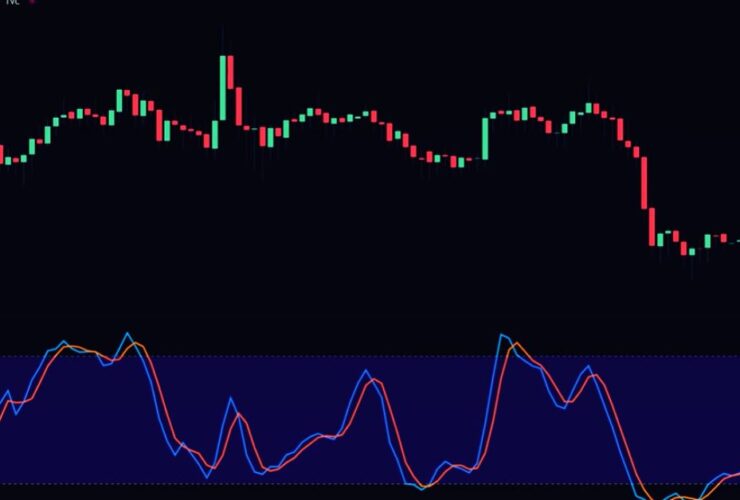
The Stochastic Oscillator Strategy is a trading method that uses the Stochastic Oscillator, a momentum indicator, to identify overbought and oversold conditions in the market. The oscillator measures the closing price relative to a price range over a specific period, generating values between 0 and 100. Traders use two key levels: above 80 indicates the market might be overbought (a ...

Binary trading is a form of financial trading where participants predict whether the price of a specific asset, such as stocks, currencies, commodities, or indices, will rise or fall within a set time frame. This type of trading is called “binary” because it offers only two possible outcomes: either the trader’s prediction is correct, resulting in a fixed profit, or ...
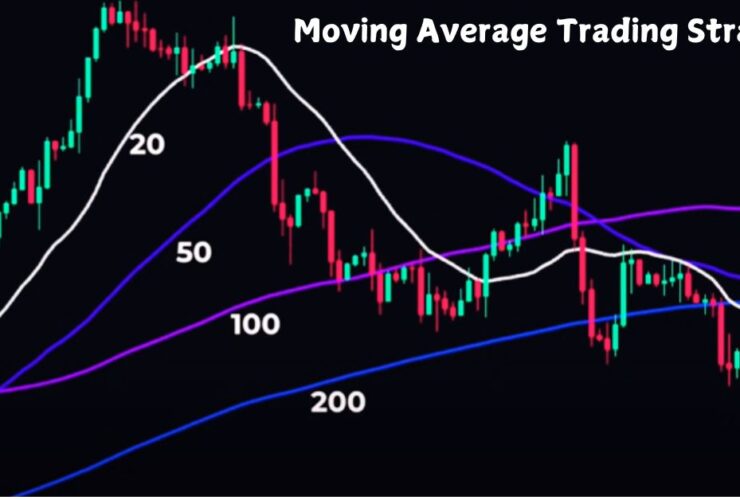
Summary The Moving Average Trading Strategy is a popular technique in technical analysis used to identify trends and potential trading opportunities in financial markets. This strategy involves calculating the average price of a security over a specific period to smooth out price fluctuations and highlight the overall trend. Two common moving averages are the Simple Moving Average (SMA), which equally ...

Bollinger Bands are a popular tool in trading and investing, designed to help people understand price trends and volatility in the market. They consist of three lines: a middle band, a moving average, and two outer bands that measure price levels above and below the average. These outer bands expand when the market is volatile and contract when it’s stable. ...